Introduction to predatoR
Berk Gurdamar
2022-12-29
Source:vignettes/predatoR_Vignette.Rmd
predatoR_Vignette.RmdQuick Start
In this section, we show you how to use predatoR package
for mutation impact prediction.
predatoR package makes prediction about impact of a
mutation based on an Adaboost model and classifies the
mutations as Pathogenic or Neutral.
Model was created by using Varibench and ClinVar datasets. Missense3D dataset
also used for method comparison.
Installation
You can install the predatoR via devtools:
Workflow
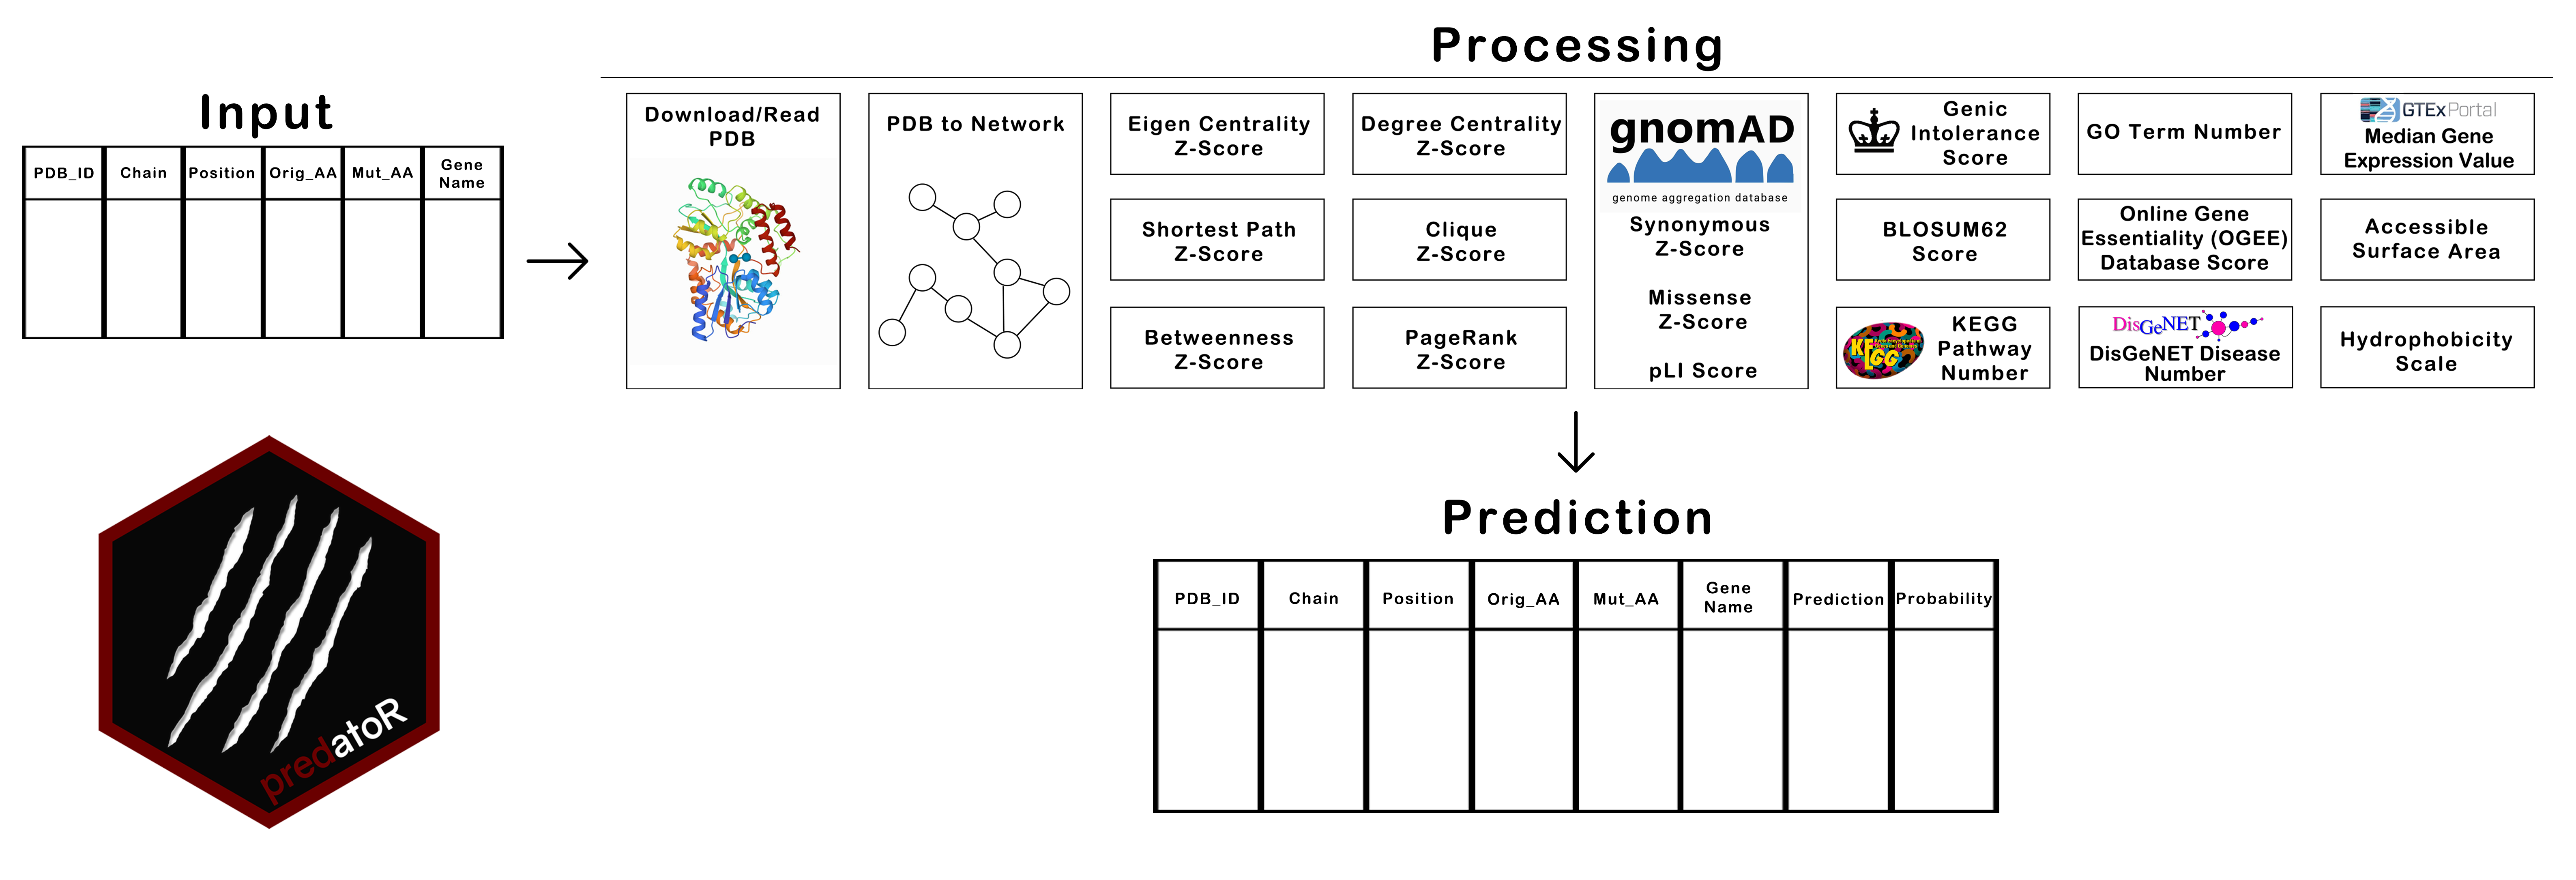
predatoR() function is the wrapper function of the
predatoR package. predatoR() gets a data.frame
structure as an input. Input should contain 5 mandatory and 1 optional
columns. Mandatory columns are ‘PDB_ID’,
‘Chain’, ‘Position’,
‘Orig_AA’ and ‘Mut_AA’.
‘Gene_Name’ column is optional. Predictions can be made
by using 2 different models, 5 Angstrom (Å)-all atoms model and
7Å-carbon alpha (Cα) atoms only model.
predatoR() function works on each PDB ID respectively.
For each PDB ID;
- Downloads/Reads PDB file
- Calculates distance between each atom in the structure
- Creates a network from PDB
- Calculates Degree Centrality Z-Score of each atom
- Calculates Eigen Centrality Z-Score of each atom
- Calculates Shortest Path Z-Score of each atom
- Calculates Betweenness Z-Score of each atom
- Calculates Clique Z-Score of each atom
- Calculates PageRank Z-Score of each atom
- Gets gnomAD Synonymous Z-Score, Missense Z-Score, and pLI Score
- Gets BLOSUM62 score of the mutation
- Finds the number of KEGG Pathways which contains the input gene
- Gets Genic Intolerance Score
- Finds the number of GO terms associated with the input gene
- Finds the number of diseases associated with the input gene from DisGeNET
- Gets the Gene Essentiality Score from Online Gene Essentiality (OGEE) Database
- Calculates the median gene expression value of the input gene from GTEx
- Calculates 6 different features from Accessible Surface Area and Hydrophobicity Scale of reference and mutant amino acids
- Makes prediction
If predatoR() couldn’t find any information of any gene
such as ‘Genic Intolerance Score’, those inputs will be removed from the
query before the prediction step.
Arguments
predatoR() function has 6 arguments;
- info_df: Input data.frame
- PDB_path: PDB file path if the user wants to use PDB structures stored locally (default = NULL)
- n_threads: Number of threads (default = NULL)
- gene_name_info: Whether there is gene name information in the input or not (default = TRUE)
- distance_cutoff: distance cutoff for setting edges (default = 5)
- network_approach: network building approach; “all” (default) for using all atoms only or “ca” for using ca atoms only
When running the predatoR() function, if gene name is
included in the input, gene_name_info should be set as
TRUE. If there is no gene name information in the input
(gene_name_info = FALSE), predatoR() function
gets the related gene names from Ensembl and if there are multiple
genes annotated for the PDB ID, choose the gene having the higher gnomAD
metrics.
predatoR() can make predictions using 7Å or 5Å distance
cutoffs. For exploratory purposes, different cutoffs can be used and
network properties can be calculated.
Example input with the ‘Gene_Name’ information included:
| PDB_ID | Chain | Position | Orig_AA | Mut_AA | Gene_Name |
|---|---|---|---|---|---|
| 3SQJ | A | 196 | GLN | LEU | ALB |
| 3SQJ | A | 396 | GLU | LYS | ALB |
Example input with the ‘Gene_Name’ information does not included:
| PDB_ID | Chain | Position | Orig_AA | Mut_AA |
|---|---|---|---|---|
| 3SQJ | A | 196 | GLN | LEU |
| 3SQJ | A | 396 | GLU | LYS |
prediction_result <- predatoR(test_data, gene_name_info = FALSE)predatoR() function can also work with no gene name
inputs. If a mutation has no gene name information, it gets the related
gene names from Ensembl and if
there are multiple genes annotated for the PDB ID, gets the gene which
has maximum GnomAD scores (gene_name_info should set as
TRUE).
| PDB_ID | Chain | Position | Orig_AA | Mut_AA | Gene_Name |
|---|---|---|---|---|---|
| 3SQJ | A | 196 | GLN | LEU | ALB |
| 3SQJ | A | 396 | GLU | LYS | ALB |
| 1A4Y | A | 169 | PRO | LEU |
prediction_result <- predatoR(test_data, gene_name_info = TRUE)predatoR() function uses
max_thread_number - 1 as a default when
n_threads = NULL. n_threads can be set by
user.
prediction_result <- predatoR(test_data, n_threads = 8) # 8 threads will be usedpredatoR() function downloads each PDB by default
(PDB_path = NULL) or can use PDB files stored locally when
PDB_path specified. It will automatically read and process
the input PDB file from the path.
prediction_result <- predatoR(test_data, PDB_path = "path/to/PDB/files/") Result
predatoR() function returns a data.frame which contains
additional two columns; ‘Prediction’ and
‘Probability’. ‘Prediction’ represents
the result of the impact prediction and ‘Probability’
represents the probability that the mutation classified as
Pathogenic or Neutral.
| PDB_ID | Chain | Position | Orig_AA | Mut_AA | Gene_Name | Prediction | Probability |
|---|---|---|---|---|---|---|---|
| 3SQJ | A | 196 | GLN | LEU | ALB | Neutral | 0.6521832 |
| 3SQJ | A | 396 | GLU | LYS | ALB | Neutral | 0.6009792 |
Exploratory Usage
Network properties can be calculated by using different distance
cutoffs. In this approach, predatoR() does not make any
prediction about the mutation, but returns a data frame contains all 24
features annotated to the dataset. Both network formalisation approaches
also can be used.
Utility Functions
The wrapper function predatoR() uses the utility
functions below;
read_PDB()PDB2connections()degree_score()eigen_centrality_score()shorteset_path_score()betweenness_score()clique_score()pagerank_score()gnomad_scores()BLOSUM62_score()KEGG_pathway_number()genic_intolerance()GO_terms()DisGeNET()gene_essentiality()GTEx()amino_acid_features()impact_prediction()
read_PDB
read_PDB() function downloads input PDB by default but
can read and process locally stored PDB structures. After reading,
create a matrix that contains only ATOM labelled structures.
Arguments
read_PDB() has 3 arguments;
- PDB_ID: PDB ID (E.g. “3SQJ”)
- PDB_path: PDB file path if files stored locally (default = FALSE)
- network_approach: network building approach; “all” (default) for using all atoms only or “ca” for using ca atoms only
PDB2connections
PDB2connections() function calculates distances between
each ATOM in the PDB structure and creates an edge between atoms if the
distance <= 5Å. As a result, returns a list contains data frames of
different chains’ interaction lists.
Arguments
PDB2connections() has 5 arguments;
-
atom_matrix: Matrix created by
read_PDB()function - filtered_info_df: data.frame contains only one PDB entries
- n_threads: number of threads (default = NULL)
-
single_run: should be set as TRUE when using
PDB2connections()function alone (default = TRUE) - distance_cutoff: distance cutoff for setting edges (default = 5)
Usage
test_data <- as.data.frame(rbind(c("3SQJ", "A", 3, "HIS", "GLN", "ALB"),
                                 c("3SQJ", "A", 60, "GLU", "LYS","ALB")))
colnames(test_data) <- c("PDB_ID", "Chain", "Position", "Orig_AA", "Mut_AA", "Gene_Name")
edge_list <- PDB2connections(atom_matrix = PDB_2DN2_structure, filtered_info_df = test_data, n_threads = 8, single_run = TRUE)
degree_score
degree_score() function calculates the total number of
connections of all nodes. Calculates Z-scores of each node and returns
scores of desired nodes.
Arguments
degree_score() has 2 arguments;
-
edge_list: List created by
PDB2connections()function - filtered_info_df: data.frame contains only one PDB entries
Usage
test_data <- as.data.frame(rbind(c("3SQJ", "A", 3, "HIS", "GLN", "ALB"),
                                 c("3SQJ", "A", 60, "GLU", "LYS","ALB")))
colnames(test_data) <- c("PDB_ID", "Chain", "Position", "Orig_AA", "Mut_AA", "Gene_Name")
degree_z_score <- degree_score(edge_list = edge_list, filtered_info_df = test_data)
eigen_centrality_score
eigen_centrality_score() function calculates the total
number of connections of nodes to which a node is connected. Calculates
Z-scores of all nodes and returns scores of desired nodes.
Arguments
eigen_centrality_score() has 2 arguments;
-
edge_list: List created by
PDB2connections()function - filtered_info_df: data.frame contains only one PDB entries
Usage
test_data <- as.data.frame(rbind(c("3SQJ", "A", 3, "HIS", "GLN", "ALB"),
                                 c("3SQJ", "A", 60, "GLU", "LYS","ALB")))
colnames(test_data) <- c("PDB_ID", "Chain", "Position", "Orig_AA", "Mut_AA", "Gene_Name")
eigen_centrality_z_score <- eigen_centrality_score(edge_list = edge_list, filtered_info_df = test_data)
shorteset_path_score
shorteset_path_score() function calculates the distances
between each node via shortest.paths() function of igraph
package, sum distances of each nodes, calculates Z-scores and returns
scores of desired nodes.
Arguments
shorteset_path_score() has 2 arguments;
-
edge_list: List created by
PDB2connections()function - filtered_info_df: data.frame contains only one PDB entries
Usage
test_data <- as.data.frame(rbind(c("3SQJ", "A", 3, "HIS", "GLN", "ALB"),
                                 c("3SQJ", "A", 60, "GLU", "LYS","ALB")))
colnames(test_data) <- c("PDB_ID", "Chain", "Position", "Orig_AA", "Mut_AA", "Gene_Name")
shorteset_path_z_score <- shorteset_path_score(edge_list = edge_list, filtered_info_df = test_data)
betweenness_score
betweenness_score() function calculates Betweenness
Score of each node by using betweenness() function of
igraph package, turns the scores into Z-scores and returns scores of
desired nodes.
Arguments
betweenness_score() has 2 arguments;
-
edge_list: List created by
PDB2connections()function - filtered_info_df: data.frame contains only one PDB entries
Usage
test_data <- as.data.frame(rbind(c("3SQJ", "A", 3, "HIS", "GLN", "ALB"),
                                 c("3SQJ", "A", 60, "GLU", "LYS","ALB")))
colnames(test_data) <- c("PDB_ID", "Chain", "Position", "Orig_AA", "Mut_AA", "Gene_Name")
betweenness_z_score <- betweenness_score(edge_list = edge_list, filtered_info_df = test_data)
clique_score
clique_score() function calculates Clique Z-scores score
of each atom and returns the desired nodes’ scores.
Arguments
clique_score() has 4 arguments;
-
edge_list: List created by
PDB2connections()function - filtered_info_df: data.frame contains only one PDB entries
- n_threads: number of threads (default = NULL)
-
single_run: should be set as TRUE when using
clique_score()function alone (default = TRUE)
Usage
test_data <- as.data.frame(rbind(c("3SQJ", "A", 3, "HIS", "GLN", "ALB"),
                                 c("3SQJ", "A", 60, "GLU", "LYS","ALB")))
colnames(test_data) <- c("PDB_ID", "Chain", "Position", "Orig_AA", "Mut_AA", "Gene_Name")
clique_z_score <- clique_score(edge_list = edge_list, filtered_info_df = test_data, n_threads = 8, single_run = TRUE)
pagerank_score
pagerank_score() function assigns an importance score to
every node via page_rank() function of igraph package.
Turns the scores into Z-scores and returns scores of desired nodes.
Arguments
pagerank_score() has 2 arguments;
-
edge_list: List created by
PDB2connections()function - filtered_info_df: data.frame contains only one PDB entries
Usage
test_data <- as.data.frame(rbind(c("3SQJ", "A", 3, "HIS", "GLN", "ALB"),
                                 c("3SQJ", "A", 60, "GLU", "LYS","ALB")))
colnames(test_data) <- c("PDB_ID", "Chain", "Position", "Orig_AA", "Mut_AA", "Gene_Name")
pagerank_z_score <- pagerank_score(edge_list = edge_list, filtered_info_df = test_data)
gnomad_scores
gnomad_scores() function gets input gene’s gnomAD
Synonymous Z-Score, Missense Z-Score, and PLI Score from data retrieved
from gnomAD. If there
is no gene name information in the input, gnomad_scores()
finds the genes that related with input PDB chain ID by using a dataset
retrieved from Ensembl. If there
are multiple genes annotated for same PDB Chain ID,
gnomad_scores() function gets the gene that has maximum
Synonymous Z-Score, Missense Z-Score, and pLI Score.
Arguments
gnomad_scores() has 1 arguments;
- filtered_info_df: data.frame contains only one PDB entries
Usage
test_data <- as.data.frame(rbind(c("3SQJ", "A", 3, "HIS", "GLN", "ALB"),
                                 c("3SQJ", "A", 60, "GLU", "LYS","ALB")))
colnames(test_data) <- c("PDB_ID", "Chain", "Position", "Orig_AA", "Mut_AA", "Gene_Name")
gnomad_score <- gnomad_scores(filtered_info_df = test_data)
BLOSUM62_score
BLOSUM62_score() function returns BLOSUM62 scores of
input mutations.
Usage
test_data <- as.data.frame(rbind(c("3SQJ", "A", 3, "HIS", "GLN", "ALB"),
                                 c("3SQJ", "A", 60, "GLU", "LYS","ALB")))
colnames(test_data) <- c("PDB_ID", "Chain", "Position", "Orig_AA", "Mut_AA", "Gene_Name")
BLOSUM62_scores <- BLOSUM62_score(info_df = test_data)
KEGG_pathway_number
KEGG_pathway_number() function finds the number of KEGG
Pathways associated with the input genes.
Arguments
KEGG_pathway_number() has 1 arguments;
- filtered_info_df: input data.frame contains only one PDB entries
Usage
test_data <- as.data.frame(rbind(c("3SQJ", "A", 3, "HIS", "GLN", "ALB"),
                                 c("3SQJ", "A", 60, "GLU", "LYS","ALB")))
colnames(test_data) <- c("PDB_ID", "Chain", "Position", "Orig_AA", "Mut_AA", "Gene_Name")
KEGG_path_number <- KEGG_pathway_number(filtered_info_df = test_data)
genic_intolerance
genic_intolerance() function returns Genic Intolerance
score by using a dataset retrieved from Genic Intolerance.
Arguments
genic_intolerance() has 1 arguments;
- filtered_info_df: input data.frame contains only one PDB entries
Usage
test_data <- as.data.frame(rbind(c("3SQJ", "A", 3, "HIS", "GLN", "ALB"),
                                 c("3SQJ", "A", 60, "GLU", "LYS","ALB")))
colnames(test_data) <- c("PDB_ID", "Chain", "Position", "Orig_AA", "Mut_AA", "Gene_Name")
genic_intolerance_score <- genic_intolerance(filtered_info_df = test_data)
GO_terms
GO_terms() function returns the number of GO terms
associated with the input genes.
Arguments
GO_terms() has 1 arguments;
- filtered_info_df: input data.frame contains only one PDB entries
DisGeNET
DisGeNET() function returns number of diseases
associated with input genes by using a dataset retrieved from DisGeNET.
Arguments
DisGeNET() has 1 arguments;
- filtered_info_df: input data.frame contains only one PDB entries
gene_essentiality
gene_essentiality() function returns Gene Essentiality
scores of the input genes by using a dataset retrieved from Online Gene Essentiality (OGEE)
Database.
Arguments
gene_essentiality() has 1 arguments;
- filtered_info_df: input data.frame contains only one PDB entries
Usage
test_data <- as.data.frame(rbind(c("3SQJ", "A", 3, "HIS", "GLN", "ALB"),
                                 c("3SQJ", "A", 60, "GLU", "LYS","ALB")))
colnames(test_data) <- c("PDB_ID", "Chain", "Position", "Orig_AA", "Mut_AA", "Gene_Name")
gene_essentiality_score <- gene_essentiality(filtered_info_df = test_data)
GTEx
GTEx() function calculates the median gene expression
value with using 54 different tissue types’ median gene expression value
from GTEx and returns the
values of input genes.
amino_acid_features
amino_acid_features() function returns 6 different
features:
- Accessible Surface Area of reference amino acid
- Accessible Surface Area of mutant amino acid
- Accessible Surface Area difference of mutant and reference amino acid
- Hydrophobicity Scale of reference amino acid
- Hydrophobicity Scale of mutant amino acid
- Hydrophobicity Scale difference of mutant and reference amino acid
Arguments
amino_acid_features() has 1 arguments;
- info_df: input data.frame contains all the mutations
Usage
test_data <- as.data.frame(rbind(c("3SQJ", "A", 3, "HIS", "GLN", "ALB"),
                                 c("3SQJ", "A", 60, "GLU", "LYS","ALB")))
colnames(test_data) <- c("PDB_ID", "Chain", "Position", "Orig_AA", "Mut_AA", "Gene_Name")
gene_essentiality_score <- amino_acid_features(info_df = test_data)
impact_prediction
impact_prediction() function makes impact prediction and
classifies the mutation as Pathogenic or
Neutral.
Arguments
impact_prediction() has 3 arguments;
- final_df: data.frame contains all the required information for impact prediction
- distance_cutoff: distance cutoff for setting edges (default = 5)
- network_approach: network building approach; “all” (default) for using all atoms only or “ca” for using ca atoms only
Usage
From an input data.frame containing PDB_ID,
Chain, Position,
Orig_AA, Mut_AA,
Gene_Name, degree_z_score,
eigen_z_score, shortest_path_z,
betwenness_scores_z, clique_z_score,
pagerank_z_score, syn_z,
mis_z, pLI,
blosum62_scores, kegg_pathway_number,
genic_intolerance, go_terms,
disgenet, gene_essentiality,
gtex, ref_asa,
mut_asa, asa_diff,
ref_hyd, mut_hyd and
hyd_diff scores impact_prediction()
function classifies the mutation as Pathogenic or
Neutral.
Example input:
prediction_result <- impact_prediction(final_df) | PDB_ID | Chain | Position | Orig_AA | Mut_AA | Gene_Name | Prediction | Probability |
|---|---|---|---|---|---|---|---|
| 3SQJ | A | 196 | GLN | LEU | ALB | Neutral | 0.6521832 |
| 3SQJ | A | 396 | GLU | LYS | ALB | Neutral | 0.6009792 |